

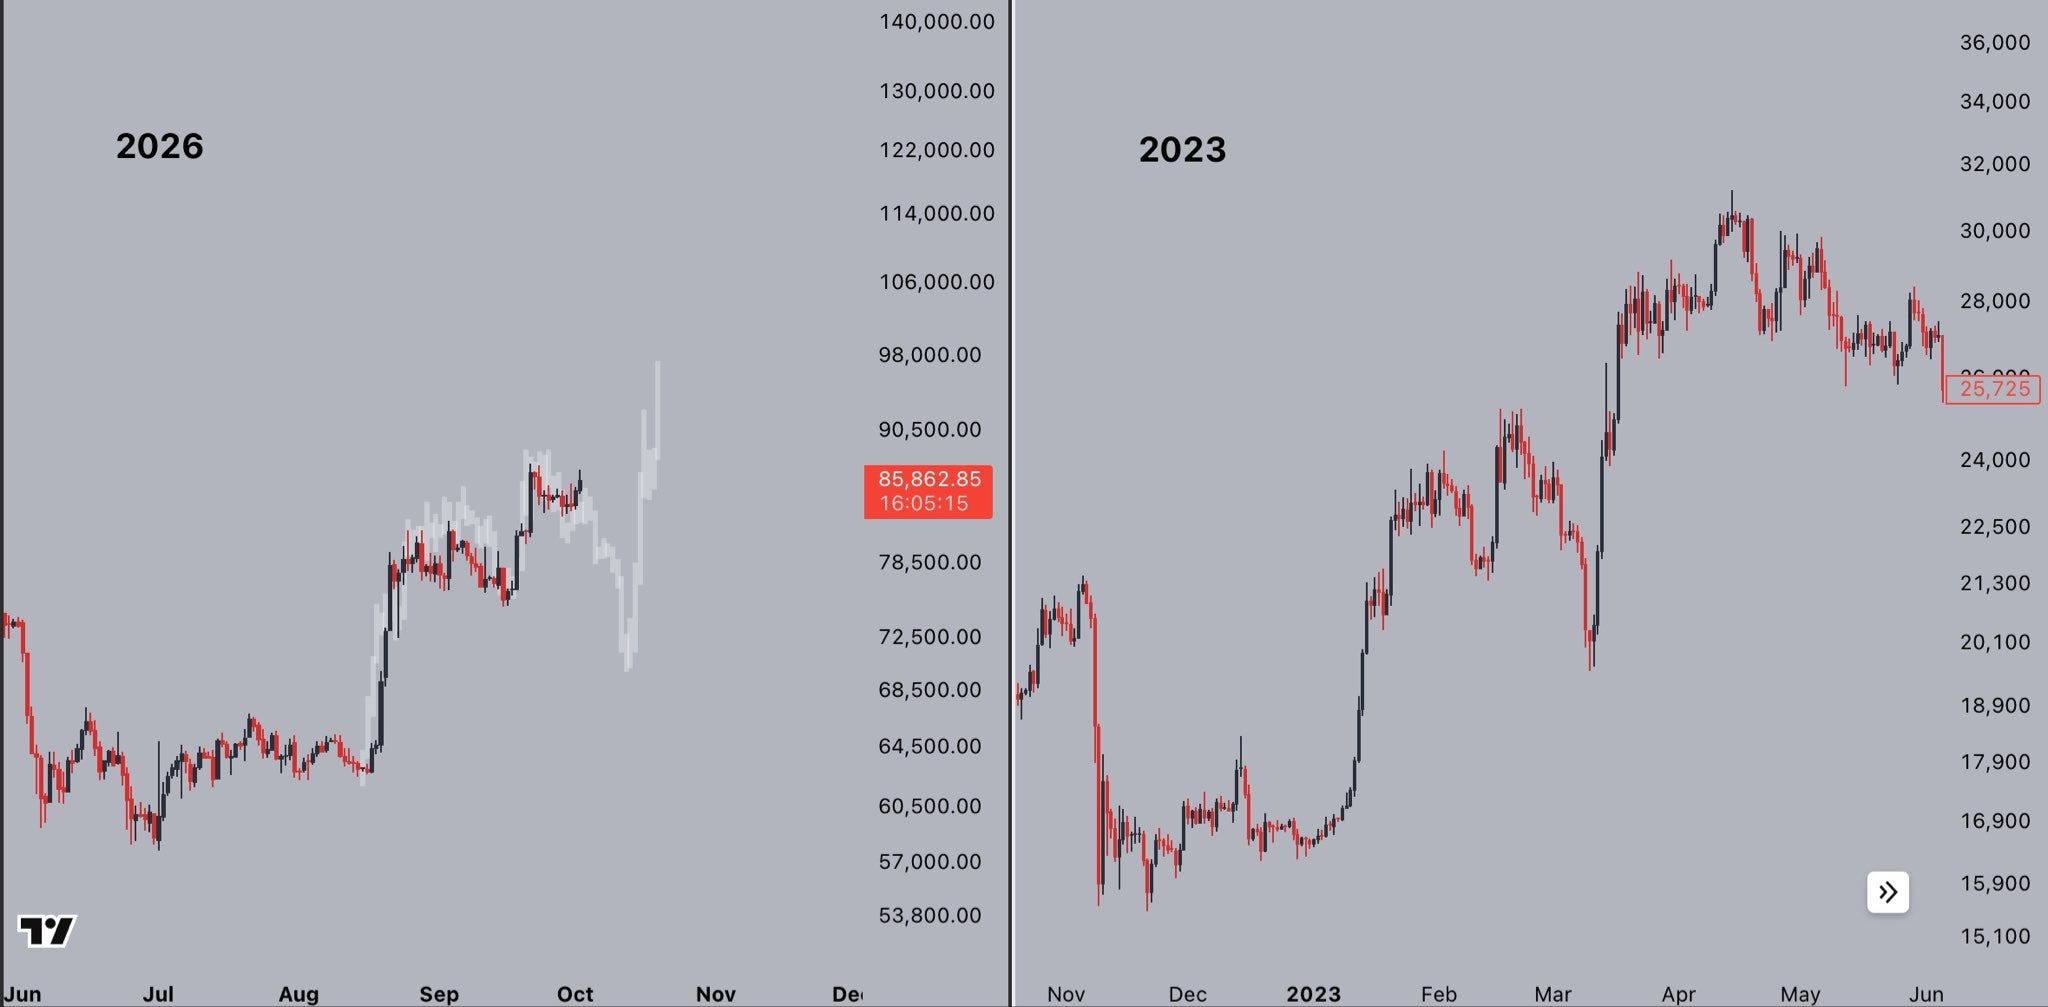
I have bought, sold, traded and research Bitcoin for over fifteen years. One of the most fascinating aspects of Bitcoin is its peculiar relationship with time. Its monetary policy is predictable, its supply is mathematically constrained, and its network continuously adjusts to changes in computing power. Yet its market price remains extraordinarily volatile, influenced by liquidity, investor psychology, institutional adoption, and the broader economic environment.
My working thesis is that Bitcoin could reach $240,000 in the second or third quarter of 2029. The entry into that thesis came on August 20, 2026, when the BUY indicator in my Bitcoin workbook triggered after a prolonged period of inactivity.
I use that signal to establish an initial position. Once invested, I hold through subsequent indicator changes. The question I want to answer is whether the first BUY after an extended quiet period offers a useful entry into a longer recovery and whether the conditions for that recovery could support my 2029 target.
Why the quiet period matters
I arrived at this approach by looking at the chart. After a long stretch without BUY triggers, a fresh signal seemed more meaningful than one appearing amid frequent fluctuations. The quiet periods were typically longer than 100 days.
For now, I am formalizing that observation as a working rule: take the first BUY after more than 100 intervening calendar days without a BUY trigger, then hold through later indicator flips. This gives the idea a consistent historical test. The threshold remains provisional because it translates a visual observation into a rule after the fact.
The workbook combines two conditions. Its smoothed acceleration measure must be positive, and Bitcoin’s recorded price must be above its 200-observation moving average. A BUY appears when those conditions move the regime from inactive to active.
The acceleration measure starts with logarithmic returns, calculates the change in those returns, and averages the changes over five observations. It describes a change in the speed of price movement. Positive acceleration can accompany a slowing decline, so the moving-average condition helps distinguish the entry setup. Neither condition determines the ultimate cycle high.
What the historical entries show
Applying the quiet-period rule identifies April 2, 2019 and January 13, 2023 in both the public daily price series and my workbook. The public series records 386 quiet calendar days before the 2019 trigger and 381 before the 2023 trigger.
To avoid crediting a signal with a price move that occurred before it was knowable, the historical test enters at the following day’s reference price. It then holds for fixed horizons, ignoring later indicator changes.
Calculated from Coin Metrics daily reference prices. Returns are gross, measured from the following close, before costs or taxes. Drawdown measures the largest decline from a subsequent running price peak, rather than the largest loss below the entry price.
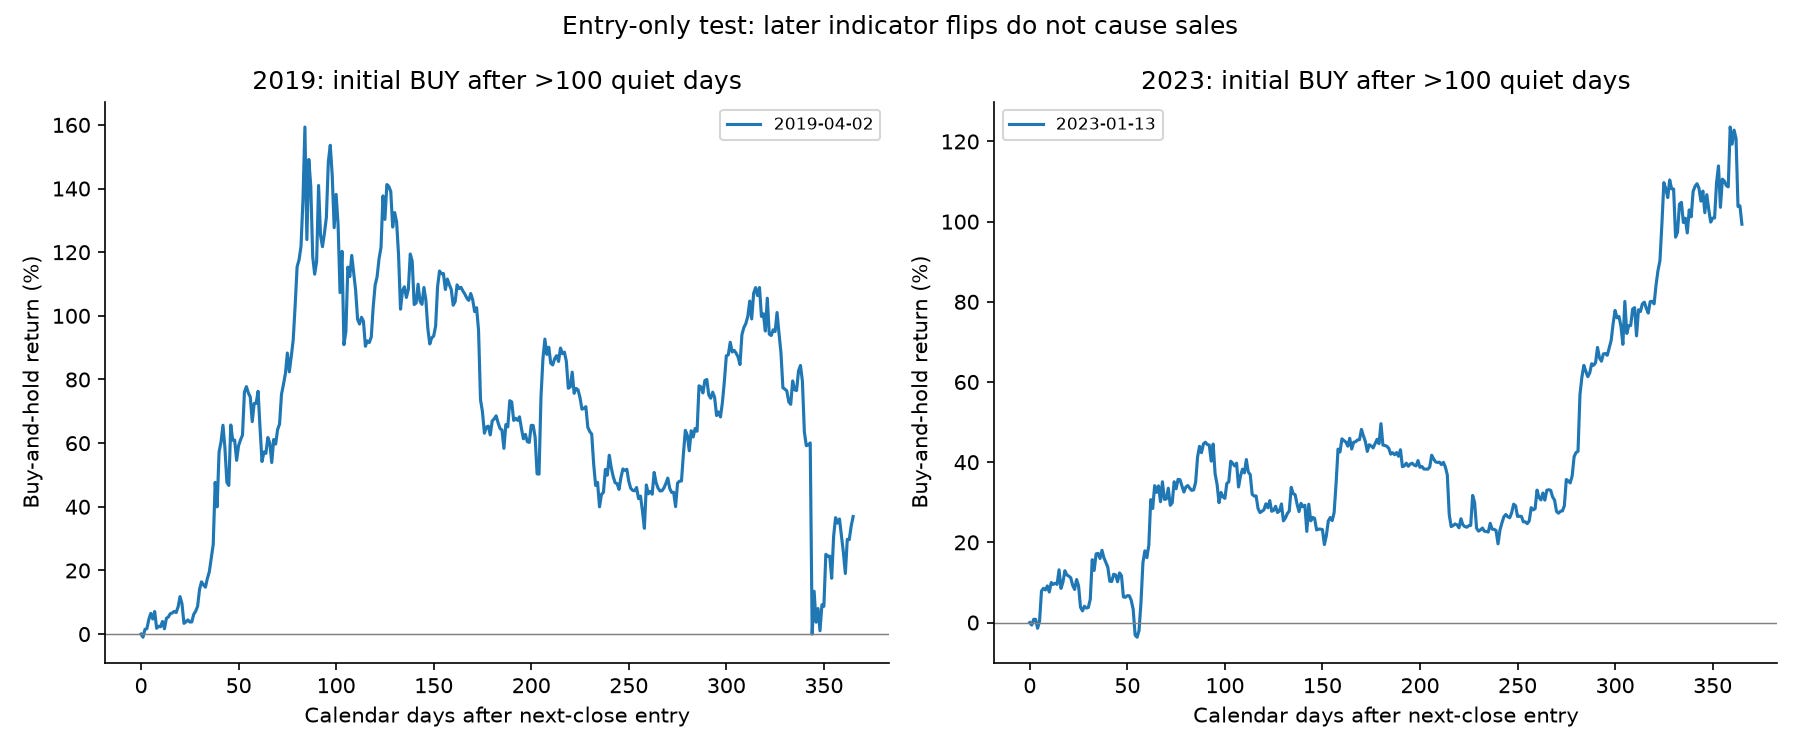
Those results are encouraging. Both entries preceded substantial appreciation over six months and remained profitable after a year. They also show why a good entry and an easy holding period are different things. The 2019 position endured a severe decline from its subsequent peak, including the March 2020 collapse.
The broader public history produces four qualifying entries: January 2012, June 2015, April 2019 and January 2023. All four had positive six-month and one-year returns. The first two, however, had negative 90-day returns. The pattern suggests that patience may be central to the approach.
Four historical cases are a small sample. Bitcoin’s early market differed substantially from today’s, and the quiet-period rule was formalized after inspecting the chart. These outcomes support further investigation; they do not establish a near-certain success rate or a calibrated probability of reaching $240,000.
The August 20 entry
In my workbook, the previous BUY occurred on November 2, 2025. August 20, 2026 therefore followed 290 intervening calendar days without a recorded BUY, comfortably beyond the provisional threshold.
The workbook records Bitcoin rising from approximately $64,269 on August 19 to $73,030 on August 20, crossing above its roughly $69,629 moving average. Smoothed acceleration was already positive before the trigger. The August 20 BUY was the transition into the combined active regime.
That fits the setup I was looking for: a fresh entry after a long quiet period. There are important data limits. Twelve calendar dates are absent from that gap, so I cannot prove that no trigger would have appeared on missing dates. The retrieved public price archive ends in May 2026, leaving the workbook’s August prices independently unverified in this study. The source file also lacks completed forward horizons for the August entry.
Connecting the entry to $240,000
The entry signal and the price target answer different questions. The signal helps identify when I am willing to begin a long-term position. The target depends on how Bitcoin develops through the expected 2028 halving and the period afterward.
A $240,000 price requires a 2.67-fold increase from a $90,000 halving price, a 1.60-fold increase from $150,000, or a 1.20-fold increase from $200,000. That makes the price entering the halving a critical assumption.
Historical cycle appreciation has compressed as Bitcoin has matured, but there are too few completed cycles to turn that pattern into a stable forecasting law. Timing also varies. In the public series, the highest price within the 2020-to-2024 halving interval occurred in March 2024, before the next halving. A simple calendar narrative can miss changes in the sequence of market highs.
Q2–Q3 2029 remains my proposed window for the target and a possible cycle culmination. Bitcoin’s protocol sets the subsidy schedule in blocks; it does not set a price or a peak date. The initial entry evidence cannot validate that timing on its own.
Putting probabilities around the assumptions
The scenario model varies the assumed 2028 halving price, the amount of subsequent appreciation under different degrees of cycle compression, and a judgmental liquidity effect. It uses historical 2023–2025 daily returns to inform volatility and assumes an April 20, 2028 halving date for the calculation.
Conditional on a $150,000 halving price, the tested scenarios produce approximately 37%–94% chances of a simulated daily price reaching $240,000 between the assumed halving and September 30, 2029. Moderate compression with neutral liquidity produces about 74%.
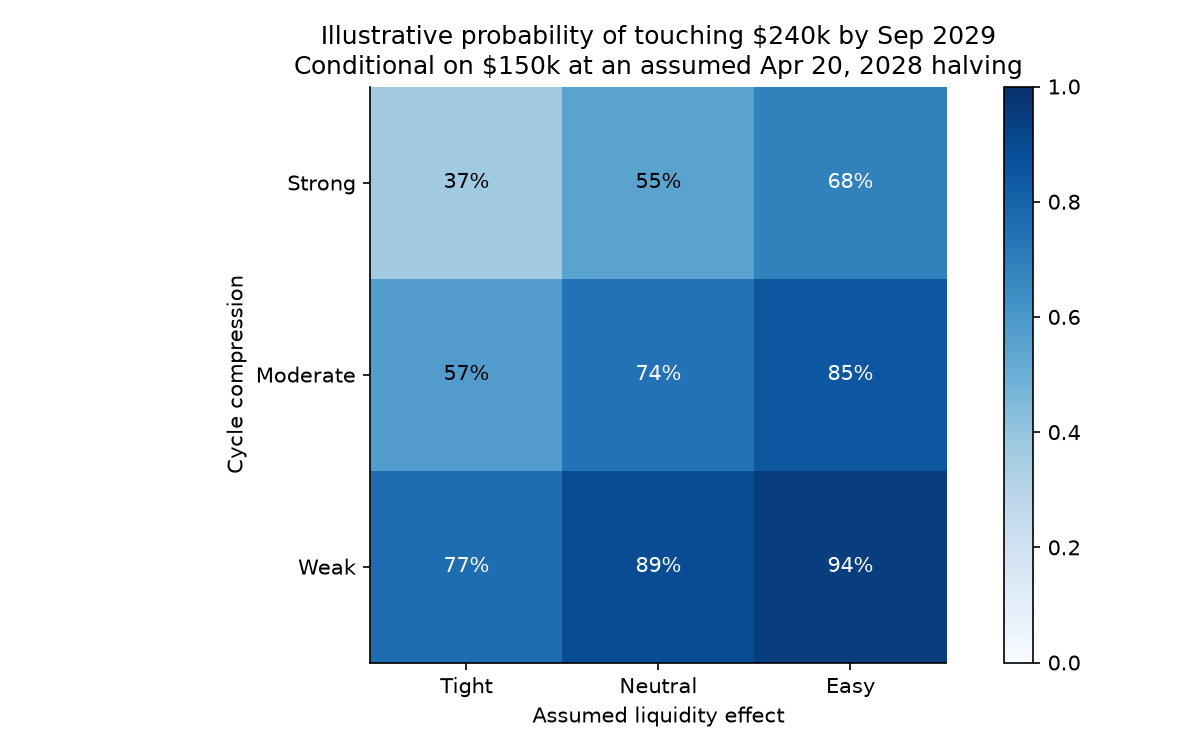
In that middle scenario, the probability of being above $240,000 on September 30 is about 59%, while the probability of touching it during April–September 2029 is about 71%. Reaching a target, finishing above it and marking the ultimate cycle peak are distinct outcomes.
These percentages are conditional model outputs, not measured odds that my thesis will succeed. The model does not forecast the halving price, estimate a validated Bitcoin/liquidity relationship, or identify a cycle peak. Its constant-volatility process also omits important features of real markets. The initial-entry backtest does not justify adding a probability premium to these scenarios.
Price appreciation and the mining transition
The 2028 subsidy reduction is another condition to watch. With an assumed subsidy of 1.5625 BTC and fees of 0.025 BTC per block, miners would receive 1.5875 BTC per block. At $240,000, that equals $381,000 in dollar revenue.
To preserve the dollar value of the pre-halving subsidy alone, price would need to rise by approximately 1.969 times the pre-halving price. If Bitcoin enters the halving at $200,000, that benchmark requires a post-halving price of roughly $393,701. Including equal fees on both sides makes the required ratio slightly higher.
Thus $240,000 could be a strong investment outcome while still falling short of preserving that particular miner-revenue benchmark. This is a revenue comparison, not a price floor or a direct security forecast. Fees, energy costs, mining efficiency, hash rate and difficulty influence the transition. Miner revenue requirements do not force buyers to pay a particular price.
My working thesis
I am retaining the first BUY after more than 100 quiet days as my provisional initial-entry rule. The 2019 and 2023 analogues support taking that setup seriously, while their holding-period risks argue for patience and position sizing that can withstand substantial declines.
I also retain $240,000 in Q2–Q3 2029 as a conditional target. Its credibility will depend on Bitcoin’s price approaching the halving, the durability of demand, financial conditions and the degree of compression in the next advance. Weakening conditions should lead me to revise the target rather than ask the entry signal to carry the entire forecast.
The August 20 trigger gives me a reason to establish the position. The years that follow must supply the evidence for the larger thesis.
Source notes
Research frozen October 11, 2026. [1] Coin Metrics community archive, downloaded BTC CSV, daily PriceUSD through May 23, 2026. Computed historical returns and peaks use this single series; reference prices differ from exchange closes and intraday highs. [2] User-confirmed Crypto Data 8.22.26 – BTC Cycle Plan.xlsx, BTC 2nd Deri, columns C–H and O; August 20 is row 3598. Extracted wrapper fallback prices through August 21; source SHA-256 and exact formulas in indicator_audit.json. August prices are not independently verified. [3] Bitcoin BIP 42 and Bitcoin Core subsidy logic: block-based subsidy, not a guaranteed calendar date or price mechanism. [4] Federal Reserve explanation of monetary policy transmission: policy affects broader financial conditions. This does not establish a stable BTC/liquidity coefficient. No source provides a calibrated probability for this thesis.